

Oil Patch
A lot of the so-called pundits believe oil prices are being buoyed by all the geopolitical turmoil, the China story and the now, as some are calling it, “double whammy,” of a weak GDP number and increasing inflation signs.
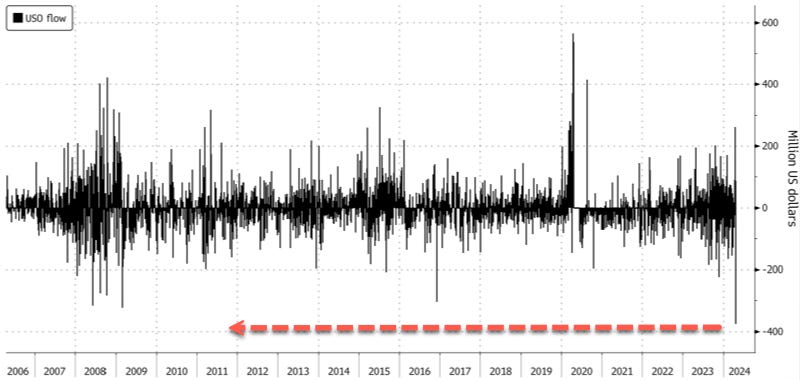
Another interesting point is the massive flow of money recently out of the largest energy ETF.
“A reduced geopolitical risk premium for Brent crude this week is likely one of the main drivers resulting in the largest daily outflows for the US Oil Fund ETF. Tensions between Iran and Israel have subsided in recent days, and it's entirely possible the White House is busy mediating both sides to ensure a wider conflict doesn't rocket Brent prices above $100/bbl. Source
Bloomberg data shows that the US Oil Fund experienced the most massive daily outflow ever on Tuesday, with investors pulling a record $376 million, exceeding the outflow of $323 million set in 2009. Though as the chart below shows, there was a huge inflow just a day or two ago...
"The timing of this activity coincides with a general easing of immediate tension in the Middle East over the weekend," John Love, chief executive officer of USCF Investments, told Bloomberg. USCF Investments is the firm that manages USO.
“The US economy grew at its slowest pace in nearly two years last quarter as inflation topped Wall Street estimates.
The Bureau of Economic Analysis's advance estimate of first quarter US gross domestic product (GDP) showed the economy grew at an annualized pace of 1.6% during the period, missing the 2.5% growth expected by economists surveyed by Bloomberg. The reading came in significantly lower than fourth quarter GDP, which was revised up to 3.4%.” Source
Meanwhile, WTI and Brent continue to hold their own.


”Oil futures shook off early losses Thursday to finish higher, with both U.S. and global benchmark prices settling at their highest in more than a week.
“Prices had spent much of the session trading lower, with the U.S. benchmark, at one point, headed toward its lowest finish in about a month. Traders weighed prospects for energy demand against a backdrop of fresh economic data and a weekly drop in gasoline consumption.” MarketWatch
“But there are other voices.
Oil prices have held steady week on week despite a significant inventory build in U.S. crude two weeks ago, which was countered by a draw in U.S. crude stockpiles for the week ending April 19th. Next to this, traders have become less concerned about a potential supply disruption in the Middle East.
The crude inventory build at the middle of the month triggered fears that oil demand could be weakening; however, Standard Chartered estimates that global inventories will increase by only 74,000 barrels per day in the month of April, a much smaller build compared with 2.2 million barrels per day (mb/d) build in April 2023 and the 1.4 mb/d build in April 2022. StanChart notes that the markets could be more sensitive to this change in trajectory following the strong counter-seasonal inventory draws during the first quarter of 2024.
Even better for the bulls, StanChart has forecast that global oil demand will pick up strongly in May and June, exceeding 103 mb/d for the first time in May (at 103.15 mb/d), increasing further in June to 103.82 mb/d.
The commodity experts have predicted global inventory draws of 1.53 mb/d in May and 1.69 mb/d in June, tightening physical spreads significantly. StanChart also says that OPEC is unlikely to increase output in the near-term thanks to the stall in the oil price rally despite having room for at least 1 mb/d of extra OPEC output in Q3 without increasing inventories.
With the next key ministerial meeting just six weeks away, concerns about demand and the macroeconomic environment are likely to dominate the meeting. StanChart says we are likely to record a 1.6 mb/d Q3 draw in stocks if there is no increase in OPEC output, compounding the price effect of a H1-2024 draw of 1.1 mb/d.
U.S. Sanctions on Iranian Oil
Recently, the Biden administration passed new sanctions on Iran’s oil sector as part of the $95-billion foreign aid package to Ukraine, Israel and Taiwan. In a move aimed at reducing Iran’s oil trade with China, the broadened sanctions now target Chinese banks that conduct transactions involving Iranian crude and products.
The sanctions now include foreign refineries, vessels, and ports that knowingly process, transfer, or ship crude oil in violation of existing sanctions. The new sanctions could prove significant in disrupting market fundamentals considering that Iran currently produces about 3 million b/d and is expected to increase output by a further 280,000 b/d this year.
StanChart has predicted that whereas the upcoming U.S. presidential election may influence the timing of the next swing down in Iranian exports, Iran’s oil flows are bound to take a hit regardless of who ascends into the Oval Office in 2025.
The analysts note that existing U.S. policy instruments were enough to drive Iranian exports down to close to zero in late 2020, before the international context, and the associated implementation policies, changed. StanChart has argued the Biden administration has room to start implementing the sanctions immediately despite the risk of increased fuel prices during an election year. StanChart notes that the record-high on the day of a U.S. presidential election is $3.492/gal in 2012 (when the
incumbent won), equating to about $4.80/gal in 2024 money terms after adjusting for consumer inflation. That’s $1.14/gal higher than current prices, with the U.S. national gasoline price average at $3.66 per gallon. StanChart says that whereas recent U.S. international oil policy has clearly been designed with a view to moderating oil price effects, it does not mean that the U.S. has necessarily chosen a policy of minimum pressure on Iranian and Russian oil exports.
Meanwhile, the natural gas outlook appears to be getting more bullish. A late cold snap has led to a sharp deceleration in European gas inventory builds, with EU inventories standing at 72.01 billion cubic meters (bcm) on 21 April according to Gas Infrastructure Europe (GIE) data. The w/w build was just 0.427 bcm, significantly slower than the 2.005 bcm build for the week to 14 April. StanChart, however, says the cold snap might not last long, meaning Europe is likely to still be faced with a gas glut in the summer.
The U.S. gas outlook is, however, more bullish after National Weather Service (NWS) meteorologists forecast above-average summer heat across the vast majority of the country, setting the stage for increased cooling demand. Source
The crude inventory build at the middle of the month triggered fears that oil demand could be weakening.
StanChart has forecast that global oil demand will pick up strongly in May and June, exceeding 103 mb/d for the first time in May.
With the next key ministerial meeting just six weeks away, concerns about demand and the macroeconomic environment are likely to dominate the meeting.