

Investment Journey
We have our own opinions. We hope you have yours. Here is another one you might find interesting in your investment journey.
“Friend of Fringe Finance Lawrence Lepard released his most recent investor letter this week. He gets little coverage in the mainstream media, which, in my opinion, makes him someone worth listening to twice as closely.
“Larry was kind enough to allow me to share his thoughts heading into Q2 2024. The letter has been edited ever-so-slightly for formatting, grammar and visuals.
QUARTERLY OVERVIEW
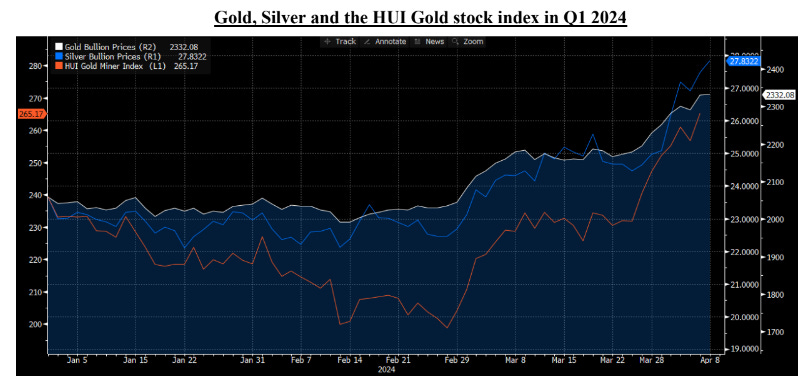
“Globally, the stock markets continued their 45-degree angle rise during the first quarter. Crude oil, and commodities broadly, also had a stair-step rise consistently during the quarter. Gold and silver and the miners were an interesting dichotomy. Bullion prices were flat to slightly down in January and February, and the miners were clobbered during those early months of Q1. However, in March the price of gold broke through the long-standing $2,070 ceiling and the miners responded, driving the Fund up by 25.4%. Gold miner indices were down 17% in the first two months before the March move.
Note that the gold mining stocks still have not provided any leverage to the price of gold. In fact, in the first quarter they did not even keep pace with the increase in the price of gold. With gold up 8.1% in the quarter, the gold mining indices were up 2%. Typically, gold miners provide 2x to 3x leverage in terms of returns; so, with gold up 8%, the miners would typically have been up 16% to 24%. This supports our thesis that the miners are still undervalued and are going to mean revert with a vengeance as this bull market in gold continues. The gold mining shares have a long way to go before they reflect fair value. Source
THE MARKETS SPEAK: GOLD BREAKS OUT
We have been waiting for a conclusive Federal Reserve loosening of financial conditions (monetary expansion) to light a fire under our Fund’s assets. While we have seen some hints that the Fed is going in that direction, they are sending mixed signals. In our view, the big story in Q1 was that the markets said, “OK, we have seen enough, we know what’s coming, so let’s get going.”
In the first quarter, the price of gold definitively broke out from its long-term price cap of ~$2,070 per ounce. Gold’s price had bumped up against this cap four times over the past four years. Notably, gold topped out at $1,900 in 2011 before starting a multi-year correction. Breaking through a top that had been in place for over a decade is a big deal.
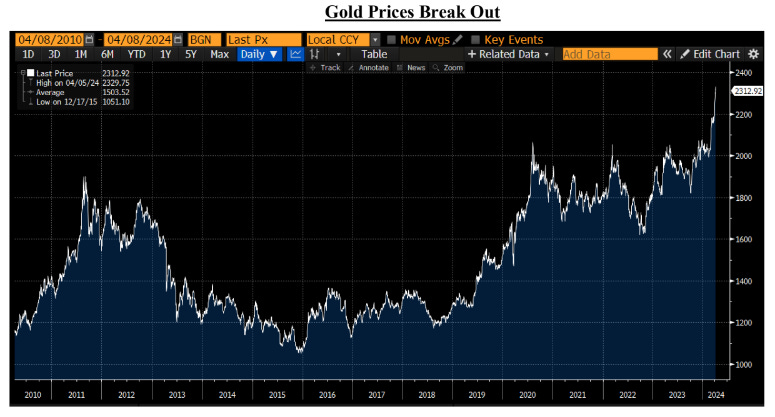
And it was not just gold. The other sound money assets have participated too. Bitcoin started the year at $42,802 and hit an all-time high of $72,740 in early March (up 67% in the Quarter!). Silver also broke through long-term resistance, although it has much further to go to hit an all-time high.
Markets reflect current conditions, but more importantly, they price in future expectations. We strongly believe that more investors are waking up to the monetary trap that the Fed has placed itself in. Consider, there have been three crises in the last 18 months that the sound money assets are reacting to:
• October 2022 – UK Gilt crisis…the Bank of England printing
• March 2023 – Silicon Valley Bank / Regional Bank Crisis…. FDIC guarantees all deposits and Fed prints with the BTFP.
• October 2023 – 10-year U.S. Treasury yield abruptly goes above 5%.....Fed begins Dovish talk, signals rate hike cycle over and soft pivots.
Gold, Silver and Bitcoin are reacting to both that recent intervention plus front running the next round of money printing or monetary accommodation that will occur in the coming crisis (and given the debt load, the next crisis could be massive). This move in sound money assets is different.
This is best demonstrated in the chart below which shows the price of gold compared to the “real yield” on the U.S. 10 Year bond (inverted). Note that the “real yield” is the yield on the 10-year U.S. Treasury bond minus the current expectation for average inflation rates over the next 10 years. For example, today the 10-year treasuries are yielding about 4.5%, and 10-year inflation swaps are priced at ~2.5%, reflecting the expectation that inflation will average 2.5% for the next ten years. (we don’t think it will). This leads to a “real yield” of 2% as shown in the chart below.
One of the long-standing relationships in finance is that when real yields are higher, gold is less attractive. Gold pays no yield, but it protects against debasement. When real yields are positive or trending positive, gold suffers. When real yields are negative or trending negative, gold does well. Note the tight correlation from 2006 to 2020 in the chart below.
Now, the important point is to look at what happened starting in 2022. Due to the Federal Reserve’s rate hiking campaign, real yields have gone up substantially and YET, gold went up! In our opinion this is a huge clue. Something is different. We believe the gold market is sniffing out the global debt and fiscal problems that are present in the United States and that it is anticipating future monetary debasement.
Perhaps this is why we see news stories like this:
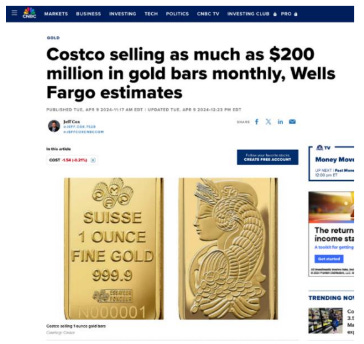
USA Today reports Costco’s CFO telling investors: “When we load them on the site, they are typically gone within a few hours, and we limit them to two per member.” Costco is now expanding into silver coin sales as well. (h/t Dan Oliver, Myrmikan for the quote).
U.S. FISCAL SITUATION GOES CRITICAL
Perhaps all of the awareness that we described above is because it is very hard to ignore the math and the recent headlines like the one below from March 4, 2024:
Now it is unfair to annualize this because there is some lumpiness in the monthly data; however, with 365 days in a year this implies a deficit of $3.65 Trillion/year. In the first Federal fiscal quarter that ended December 31, 2023, the deficit was $500 Billion implying a $2.0 Trillion annual deficit. Q2, which ended March 3, was just reported, and the deficit was $600 Billion. For the first half of fiscal 2024 the U.S. Federal Government recorded a $1.1 Trillion dollar deficit. Clearly, the current run rate is much higher.
Keep in mind that this is all with a relatively healthy economy and stock market. If the debt were to continue to grow at this rate, it would be comparable to a starting debt of $34 Trillion on December 31, 2023. It (a deficit run rate of $3.65T) would imply an annualized growth rate of 10.7% in the total debt burden. Annual debt growth of 10.7% compares very unfavorably to estimated GDP growth of 2.0-2.5%. GDP funds the interest payments on the debt and this is why the math is unrelenting. Something has to give. And by the way, the trend in this does not look good, the Biden Administration just proposed a spending budget of $7.3 Trillion for fiscal 2025 which represents a 13% increase in spending. Keep in mind that tax revenues in fiscal 2023 were only $4.4 Trillion. Where are they going to find the money?
As we showed in our last Quarterly Letter the growth in Federal Debt is stunning.

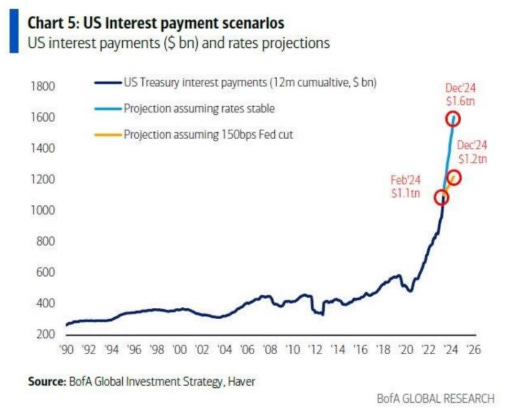
The debt growth is a problem for a number of reasons, not the least of which is the increase in the interest costs for the U.S. Federal Government. As the chart below shows the Federal Government is already paying interest at a run rate of $1.1 Trillion per year, and unless the Fed cuts the short- term interest rates by 150 bps (see yellow line), that interest bill will swell to $1.6 Trillion per year by December of 2024. There is nothing in the chart below which suggests that this monetary system is stable or sustainable.
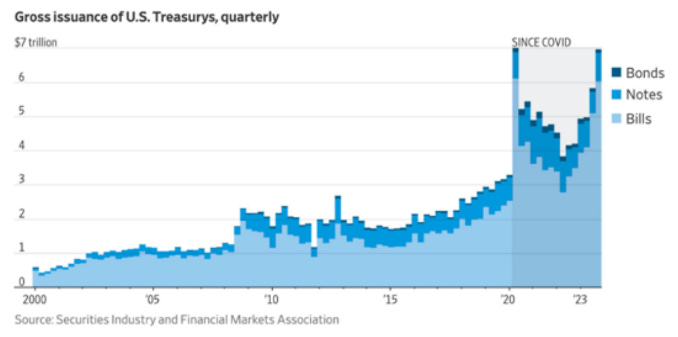
We were absolutely stunned when we saw this next chart with two significant pieces of data. First, the quarterly issuance of Treasury securities is almost back at the peak COVID levels, yet they say we are not in emergency conditions. Secondly, the pale blue line shows the percentage of securities issued in short-term bills (under one year in duration) which has swelled enormously. The United States is having a hard time selling the longer duration notes and bonds, and very notably, this is the historical pattern of countries suffering from a sovereign debt crisis. They are increasingly forced to finance their debt on a short-term basis because no one will buy their bonds for a longer duration due to the inflation risk.
FED WATCH: PARTY ON GARTH!
The Federal Reserve is clearly trapped. In the Fall of 2023, the U.S. 10-Year Bond yield shot up through 5%. This caused the Fed to panic, and they jawboned the yield back down to under 4%. They also indicated via their dot plot that most participants saw three rate cuts coming in 2024 (75 bps). In our year end letter, we prematurely called this a pivot. The problem is that the data has not helped their case. A higher stock market, strong employment figures (probably cooked) and solid economic growth combined with worse inflation data mean they now have a predicament. The numbers suggest that they are going to have a hard time attaining their 2% inflation target, and yet the chart of US interest payments on the previous page suggests that if they do not cut short-term rates, interest expense is going to soar.
It truly is a case of damned if they do cut rates and damned if they don’t. So what happens? We thought there was a lot of information in the following AP Release:
April 3 – AP (Christopher Rugaber): “Federal Reserve officials will likely reduce their benchmark interest rate later this year, Chair Jerome Powell said…, despite recent reports showing that the U.S. economy is still strong, and that U.S. inflation picked up in January and February. ‘The recent data do not … materially change the overall picture,’ Powell said…, ‘which continues to be one of solid growth, a strong but rebalancing labor market, and inflation moving down toward 2% on sometimes-bumpy path.’ Most Fed officials ‘see it as likely to be appropriate’ to start cutting their key rate ‘at some point this year,’ he added… Powell also sought to dispel any notion that the Fed’s interest-rate decisions might be affected by this year’s presidential election campaign.”
It seems Powell is going to try to “split the baby” and claim that inflation is under control as justification to cut rates. While we could be wrong, we are beginning to think that Fed Policy does NOT matter anymore. If the Fed doesn’t cut rates, something blows up and then we get a massive rate reduction and the big print. If Powell does cut rates, he keeps the game going but at the cost of higher inflation. The markets have taken away the car keys from the reckless teenager: The Fed.
Another forward-looking clue came from the Fed’s Press Conference on March 20, 2024. Powell said that they were prepared to reduce Quantitative Tightening (QT) in order to make sure there was enough money in the system. He even referred to the 2019 Repo market blow out. We believe he has been listening to Lori Logan, the Dallas Fed Governor who is very familiar with the monetary plumbing and recognizes that the math does not work. Presently, the Fed is reducing its balance sheet by $60 Billion per month via QT, and the consensus is that they will cut that amount in half soon.
Above we mentioned the big print, and there is one development which occurred during the quarter that we think is a very important signal or clue about what is to come.
On March 5, 2024, the International Swaps and Derivatives Association, Inc. (“ISDA”) wrote the Fed, FDIC, and OCC, to implement targeted reforms to the supplementary leverage ratio (the “SLR”). ISDA wrote: “To facilitate participation by banks in U.S. Treasury markets— including clearing U.S. Treasury security transactions for clients—the Agencies should revise the SLR to permanently exclude on balance sheet U.S. Treasuries from total leverage exposure, consistent with the scope of the temporary exclusion for U.S. Treasuries that the Agencies implemented in 2020.”
In plain English – the ISDA is recommending a permanent structure for the banks to perpetually fund US Treasury issuance and U.S. Deficits. They did this exact same thing in response to COVID in order to allow the banks to buy Treasuries in unlimited quantities. It is an emergency measure that was implemented when the U.S. Treasury market became illiquid in March 2020. This is a huge deal because it basically amounts to QE infinity. The Banks would have unlimited ability to purchase Treasury debt. Complete debt monetization “Banana Republic” style. Remember, it has not happened yet, but the ISDA is owned and controlled by the banks. It is pretty clear that this letter is a trial balloon.
Despite the Fed’s so-called hawkish stance, the supply of base money is still growing. (as our friend Lyn Alden educated us, this is due to the draw-down on the Fed’s reverse repo facility). Our friend, and excellent Macro Analyst Tavi Costa highlighted this issue in the following Tweet.
Our conclusion: the Fed and its banks, sooner or later, will provide more monetary accommodation or the entire debt structure will collapse. That is just math. Now, they will do everything they can to mask it, deny it, or create programs that they claim are not “money printing” (as they claimed that the 2023 Bank Term Funding Program was not money printing (it was). But, they will have to print money or else the system will collapse. The gold and bitcoin prices demonstrate that the markets know this.
Part 2 of Larry's letter, including his thoughts on gold miners, China, Russia, and gold replacing Treasuries as the neutral reserve asset, can be read here.